
Chart of Accounts for Contractors
The QBO Setup That Turns Your P&L Into a Dashboard
Most contractors using QuickBooks Online have the same problem: they get a P&L at the end of the month and the number is either good or bad, but they can't tell why.
Marketing over budget? Maybe. Fleet costs creeping? Possibly. Office wages out of proportion to revenue? Hard to say.
The problem isn't the bookkeeping. It's the Chart of Accounts.
Your COA is the skeleton of your books. It's the list of accounts that every transaction gets coded to. Its structure determines what you can and can't see in every report you run. A generic COA gives you a profit number. A trade-specific COA gives you a dashboard.
Want to skip the education and download our chart of accounts? Download it at the link here: https://acc4t.com/resource-5908
Here's the exact structure we build for every HVAC, plumbing, and electrical client we work with including the benchmark percentages for every category.
The Numbering System: Your Financial Cheat Sheet

A well-built COA uses consistent account numbering so you can find anything in seconds. Here's how it maps:
1xxx: Assets — bank accounts, vehicles, equipment, inventory
2xxx: Liabilities — AP, credit cards, payroll liabilities, loans
3xxx: Equity — owner contributions, distributions, retained earnings
4xxx: Income — all revenue accounts
5xxx: Cost of Goods Sold — direct job costs
6xxx: Overhead Expenses — everything it costs to run the business
7xxx: Other Income — interest, rebates, insurance proceeds
8xxx: Other Expenses — depreciation, reconciliation items
QBO organizes your P&L in this exact order. Once you internalize the numbering, you can navigate any financial statement without hunting.
1xxx–3xxx: Assets, Liabilities and Equity
These sections matter but are less often misstructured. Here are the improvements we most commonly make:
Assets:
Separate bank accounts for operating, payroll, and tax reserves. Keeping these distinct makes reconciliation faster and cash management cleaner.
Individual fixed assets accounts for vehicles, equipment, and leasehold improvements to more clearly see the breakdown of the assets the business owns. Bonus points if each also includes its own accumulated depreciation sub-account so your balance sheet reflects true value, not purchase price.
Liabilities:
Payroll liabilities broken out by type including federal taxes, state taxes, workers' comp, health insurance, retirement for easier matching to the relevant payments.
Vehicle loans named with lender, loan number, last four of the VIN, and monthly payment amount so you can match them to your bank feed in seconds.
Equity:
Owner draw and owner contributions live here, kept separate from operating expenses. Recording owner draws as business expenses is one of the most common errors we see because it understates net profit and distorts your true business performance.
4xxx Income: Match Your FSM Structure
Your income accounts are the first place financial reports either tell the truth or start lying to you.
The structure needs to mirror exactly how your FSM pushes revenue to QBO. Whether you're on ServiceTitan, Housecall Pro, or Jobber, you need to setup the QBO and FSM sync correctly so that the FSM routes to either distinct income accounts or distinct QBO classes. If revenue hits the wrong account then your departmental reports become unreliable. This is one of the most common sources of sync drift we see.
A few additional income accounts worth building:
Membership Revenue: separate from job revenue so you can track your recurring revenue base independently
Rebate Income: manufacturer rebates shouldn't inflate your service revenue or service material COGS numbers
Coupons and Discounts: tracked separately so they don't silently reduce your top line without visibility
5xxx COGS: Where Gross Profit Is Won or Lost
Your 5xxx section has two major categories: materials and direct labor. Both are direct costs of producing revenue and both belong above the gross profit line.

Materials COGS — target 25–30% of revenue
This includes parts and materials purchased for jobs, shop stock, equipment purchased for installation, subcontractor costs, permits, and merchant or financing fees on jobs. Subcontractors are a direct job cost so they belong in COGS, not in overhead.
If materials are consistently above 30%, you have a pricing problem, a markup problem, or a shrinkage problem. The number tells you something is wrong. The sub-accounts tell you where to look.
Direct Labor COGS — target 20–25% of revenue
This is where most contractors understate their true costs. Direct labor isn't just technician wages. The full burden includes:
Direct wages
Bonuses
Payroll taxes (FICA, FUTA, SUTA)
Health insurance
Retirement contributions
Workers' compensation
All of it belongs in 5xxx as a cost of producing revenue; not in 6xxx with your office staff. If tech wages are sitting in overhead, your gross profit is overstated and your job margins are fiction. Dive in deeper to understand your labor burden here: https://acc4t.com/post/labor-burden
Combined, materials and direct labor should run 45–55% of revenue leaving 45–55% gross profit to cover overhead and generate net profit.
6xxx Overhead: The Five Categories That Tell You Everything
This is where the COA structure pays for itself.
Most contractors have a handful of overhead accounts with generic names like "Misc Business Expenses". At the end of the month there's a single expenses number, it's over budget, and nobody knows which line item caused it.
We break overhead into five categories; each with a benchmark target. Total overhead target: 35% of revenue or less. Here's how that 35% breaks down:
Overhead Wages — target 15–20% of revenue
Office staff, CSRs, dispatchers, admin, and owner compensation. Sub-accounts mirror the direct labor structure: wages, bonuses, payroll taxes, health insurance, retirement, workers' comp but for non-field employees.
Above 20% means the office team is outpacing the revenue that supports it, or owner compensation is disproportionate to business size. Either way the number tells you it's time for a conversation.
Marketing and Advertising — target 5–10% of revenue
At minimum, separate sub-accounts for each major channel like Google Ads, Local Service Ads, Facebook, Angi, direct mail, SEO, signage. That gives you spend visibility by category.
For contractors who want to run full marketing ROI analysis, we're moving clients toward individual vendor-level sub-accounts. At that point your QBO P&L becomes your marketing ROI dashboard without needing to export anything. If you haven't read our post on tracking marketing ROI by channel, that's the natural companion piece to this one. Check it out here: https://acc4t.com/post/marketing-roi-contractors
Above 10% without proportional revenue growth means something in the funnel is broken. Below 5% while trying to grow means you're probably underspending.
Fleet and Vehicle Expenses — target 3–4% of revenue
Vehicle leases, fuel, insurance, GPS tracking, maintenance, repairs, wraps, licensing. Every truck-related dollar in one category.
If your fleet isn't showing up fully in your overhead, you can't know whether each truck is earning its keep. At 3–4% of revenue on a $2M business, that's $60,000–$80,000 a year. It deserves its own line.
Facility and Building Expenses — target 3–4% of revenue
Rent or lease, storage facilities, building maintenance, security, janitorial, utilities. If you own your building the accounting differs but the category stays the same.
This is typically the most controllable category because rent is fixed. Consistently above 4% usually means the space is too large for current revenue or storage costs haven't been examined in a while.
Remaining Overhead — target 4–8% of revenue
Communications, software subscriptions, office supplies, professional fees, business insurance, licenses, training and team-building, shop supplies, and miscellaneous operating expenses.
This is the category that creeps. Unused software subscriptions, redundant tools, vendor fees that never got cancelled after a service change. A quarterly audit of this category alone typically surfaces 1–2% of revenue in recoverable costs.
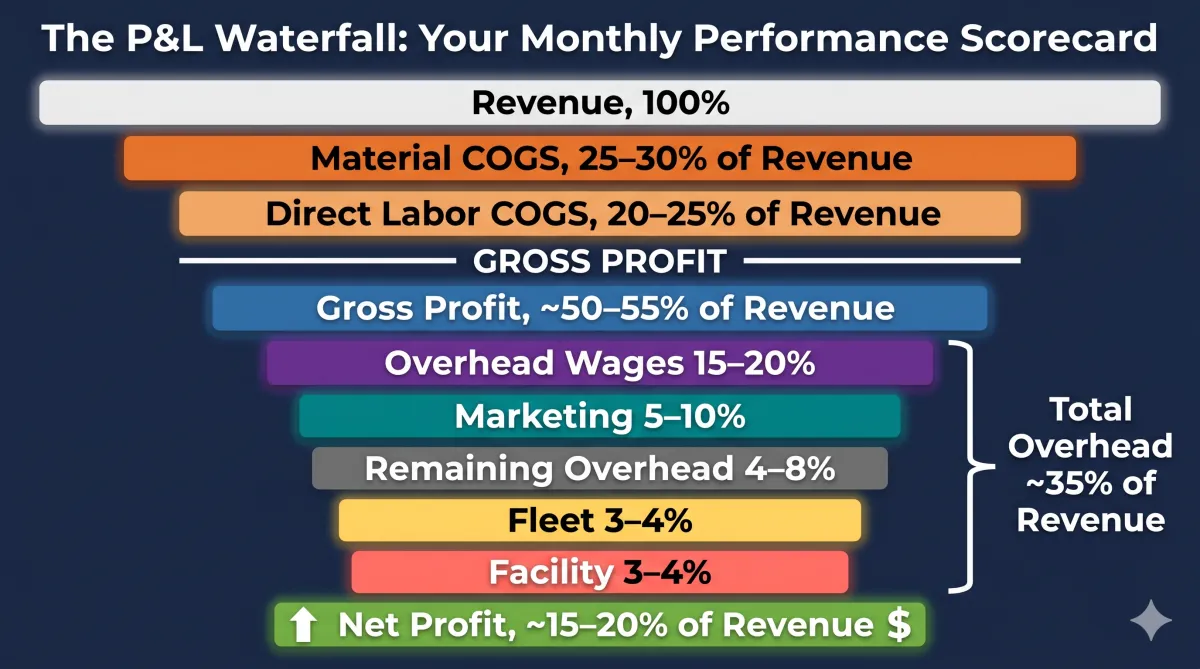
The P&L Waterfall: What It Should Look Like
When the COA is structured correctly, your monthly P&L becomes a performance scorecard:
Every month you run your P&L, you're not just looking at a profit number. You're checking five overhead categories against known benchmarks. Marketing at 12%? You know exactly where to look. Fleet at 6%? Time to review the truck roster. Overhead wages at 22%? That's a staffing conversation backed by data.
Without this structure, you're looking at one number that's over budget with no idea where to start.

The Bottom Line
Your Chart of Accounts is the one setup decision that affects every report you'll ever run. Structure it correctly once and your books work for you for years. Leave it generic and no amount of diligent bookkeeping will give you the visibility you need to actually manage the business.
We've built a free trades-specific COA template on exactly this framework. It's built for HVAC, plumbing, and electrical contractors running $0–$10M in revenue. Download it at the link here: https://acc4t.com/resource-5908
If you want someone to review your current COA setup and tell you what's missing, that's exactly what our Financial Leak Detection engagement is designed to find. Book a call here: https://meet.acc4t.com/discovery